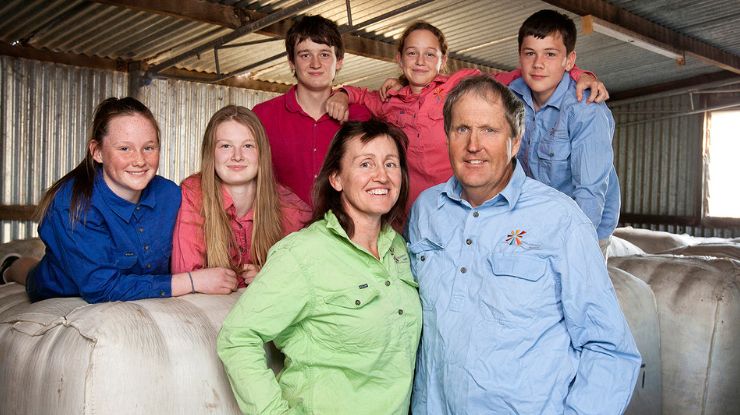
 Belinda and Deon Lay with their children Anastazia, Shannyn, Alexander, Rachelle and Darcy. Credit: DHP Photography.
Gaining control over their own data has improved productivity and efficiencies for Belinda Lay and her family at ‘Coolindown Farms’, near Esperance, WA.
The Lays have developed their own farm data store (rather than relying on third parties to store data) where they can access, combine and collate historical and current data sets to uncover new data insights and test management theories.
Belinda, who received the 2019 WA AgriFutures Rural Women’s Award for her trials of sheep location and temperature collars, has long embraced on-farm ag-tech and is involved in research into Internet of Things (IoT) technology.
IoT encompasses the billions of interconnected objects whose technology, such as sensors, allows them to share data with other devices and systems across the internet.
The Lays have progressively automated processes that are cost-effective to do so, and their involvement in Meat & Livestock Australia’s co-funded research project, which looked at using devices and data to generate return on investments (ROIs) in a mixed farming enterprise, has showcased a wide range of benefits.
The results from the project will also be used to test an ROI calculator being developed by MLA.
Return on investment
Belinda said a valuable part of being involved in the MLA project was the ability to assess the financial benefits and ROIs in the context of time savings, wages, overhead costs and increased production.
“It also helped us develop stronger thought processes around ag-tech adoption and automation,” she said.
“We found we needed to look beyond manufacturers’ prescribed applications for a range of devices to reach our ROIs.”
Belinda’s advice to other producers is to not just view ROI as a monetary return, as investing in ag-tech can also improve management, animal welfare, traceability and biosecurity, which in turn drives profits and savings.
Here’s a look at how the MLA/Coolindown project demonstrated the value of device interoperability and how embracing ag-tech can generate healthier returns on investments and more efficient management decisions.
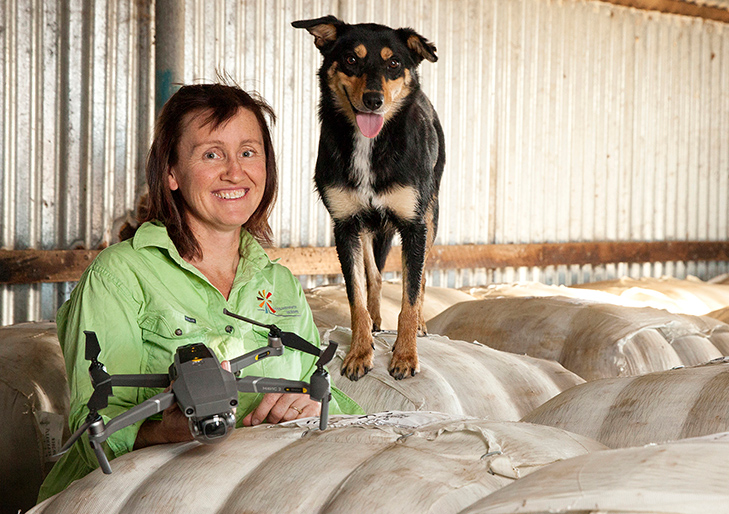
Drones save Belinda time when sheep collars notify her of any issues needing checking. Credit: DHP Photography.
Belinda’s top tech tipsMake sure you can combine a device’s data with other data sets: we compared animal movements with rainfall, crop yield and soil moisture, to gain insight into different areas. This correlation is only possible if your data is interoperable. Ask the curly questions: Ask about data ownership, how you gain access and what happens with your data. Make sure you get an answer. Installation costs: Factor these in – don’t forget fences to protect devices from livestock. Stay positive: There aren’t problems, there are only solutions, and finding them is part of the fun. Ag-tech is still in its infancy; what you want may not exist yet in the way you want it. Don’t underestimate the value of your ideas: You’re a producer and ultimately the end user – don’t give your ideas away. |
Here are four ways ag-tech data provided insights to guide on-farm management at Coolindown – despite real-world challenges such as sheep snacking on some of the technology.
Coolindown’s established use of weather stations and water tank sensors – which were already delivering results – made it the ideal site to build on these to test soil moisture probes and water flow meters as part of the MLA project.
During the project, additional level sensors were fitted to tanks and connected to the property’s existing Waterwatch phone app, as well as the AxisStream platform.
Analysis showed a remarkable 70% reduction in inputs, including human resources, fuel, wear and tear on vehicles and land, and delivering a return on investment (ROI) in just one year.
The sensors reduced annual water monitoring costs by $9,664 and returned 88 hours of work which could be reallocated to other farm activities.
“That ROI didn’t require us to look past the manufacturer’s instructions – water tank sensors just make so much sense to invest in,” Belinda said.
“To get those input reductions to 100% though is harder, as the last 30% would require significant investment.
“If we wanted to make the system fully automated, our analysis showed the ROI is not there yet. As part of this assessment, we developed an automation implementation process.”
Seven water flow meters were attached to each water source (windmills and one solar pump) and at the base of a tank to monitor the water flowing to troughs. Belinda hit some unexpected hurdles with water flow meters when sheep chewed through the cable connecting the meter to the data transmission device.
“We also found our dam water wasn’t suited to the water flow filters.
“An algal bloom inside the tanks clogged them up, which nearly led to a stock water issue as the water couldn’t flow to the troughs. Luckily, we found it in time.”
Belinda’s tip for other producers is to check out water filters and understand the water on-farm to choose the best option.
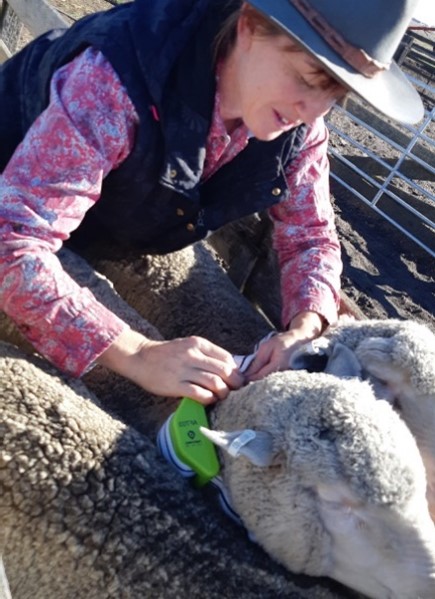
Sheep collars track temperature and GPS location and send alerts if an animal’s movements diverge from normal behaviour. Credit: DHP Photography
Digitanimal GPS tracker collars which track temperature and GPS location, were fitted to 74 twinning Merino ewes and connected through a Sigfox connectivity network.
Electronic identification device (eID) tag numbers were matched to collar IDs using a Tru-Test wand.
Collar data was sent at 20-minute intervals (accessible via smart phone), and cameras powered by solar panels and batteries were placed on trailers in the paddock. This provided observations about grazing patterns and behaviour and met animal ethics monitoring requirements.
Other information was sourced from biomass imagery, yield maps and heat maps to confirm feed utilisation patterns and animal distribution and density during lambing.
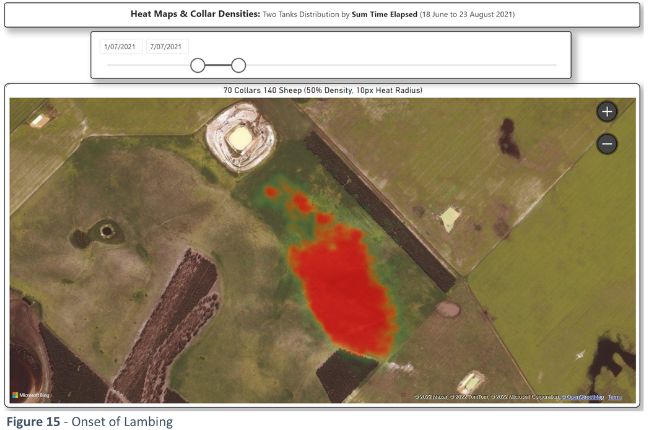
This heatmap shows paddock usage at onset of lambing. Credit: Belinda Lay.
When Belinda combined these insights with elevation and soil test data, she realised sheep were grazing heavily in elevated areas comprised of deep sands.
Plant tissue tests showed lower nitrogen levels at these points – an example of how technology revealed the ability of sheep to determine nitrogen levels in forage, potentially unearthing a way to map nitrogen.
The data also indicated ewes moved to higher elevation during lambing.
“I’m curious to understand this behaviour more and to know whether it may be related to ewes being better able to detect predators, especially as the higher areas are more exposed to the weather,” Belinda said.
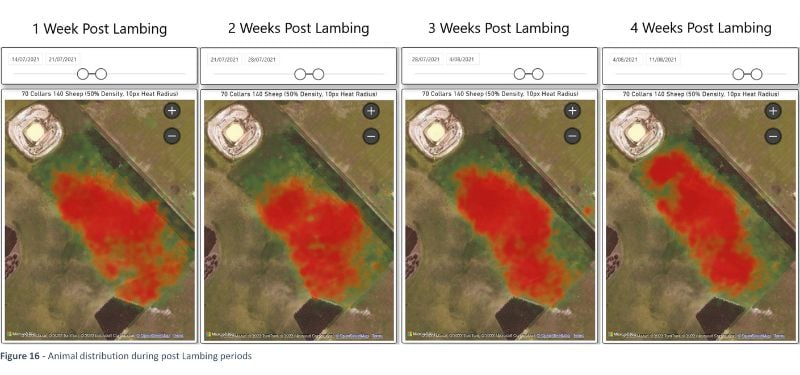
Heatmaps show paddock usage at various stages post lambing. Credit: Belinda Lay
GPS tracking sheep had a financial ROI of approximately six years, making them non-viable as a per animal deployment, however they did present the opportunity to support targeted ewe management.
ROIs were also calculated using MLA’s ag-tech ROI tool which gave similar results to other methods used, validating the usefulness of tools like this to assist producers in understanding the true value of ag-tech.
As Digitanimal collars have a higher data reading frequency rate than others on the market, adequate quality of data could still be obtained by using devices on as little as 10% of the flock.
Belinda said a better ROI can be obtained with the reduced 10% density rate, while still getting decent paddock utilisation data.
“I can now spread the devices across more mobs, gaining more insights across our operations,” Belinda said.
Producers should consider the frequency of device readings, which can impact quality of data, when assessing the ROI case for their chosen devices.
Following shearing, 525 ewe hoggets were body condition scored (BCS) and divided into three even groups prior to joining:
- high BCS
- low BCS
- a mix of high and low BCS as per traditional management.
Information was compiled from a range of sources, including eID tags, collars and sampling rations, to collate data on pregnancy scanning, BCS, distance walked and the nutritional aspects of feed.
“The data comes from multiple places. That’s the beauty of this project, we were able to bring it together to gain insights,” Belinda said.
Insights included:
- The traditional mixed BCS score group walked further than either of the other two groups.
- Interestingly, the low BCS score group conceived as many foetuses as the traditional mixed group.
- As anticipated, the high BCS group returned the highest conception rate.
- The average daily gain of the mixed BCS group dropped over time compared to the high and low BCS groups, due to the greater distances they were walking.
Overall, Belinda found these results indicated better overall flock performance is achieved when ewes are managed based on BCS.
“We will now change how ewe hoggets are managed and will separate hoggets by condition score above and below three – it’s been a great production outcome and it also enables us to target our feeding in a more efficient way,” Belinda said.
The Lays’ decision to collect and store as much data as possible against eIDs, including which paddock lambs are born in right through to vaccinations administered (including dosage rates and batch numbers) supports traceability at Coolindown, and paves the way for future management improvements.
With , the project also looked at transferring data from producers to the broader supply chain.
Belinda engaged with her local processor to see if lifetime data collected on-farm could be transferred over – she found this would require changes to the processor’s software, staff training and skills development.
Lessons learnt
|
Resources
Latest news


