Profits at three of Australia’s four biggest airports continued to grow during 2017-18, while the quality of service rose, according to the ACCC’s annual , released today.
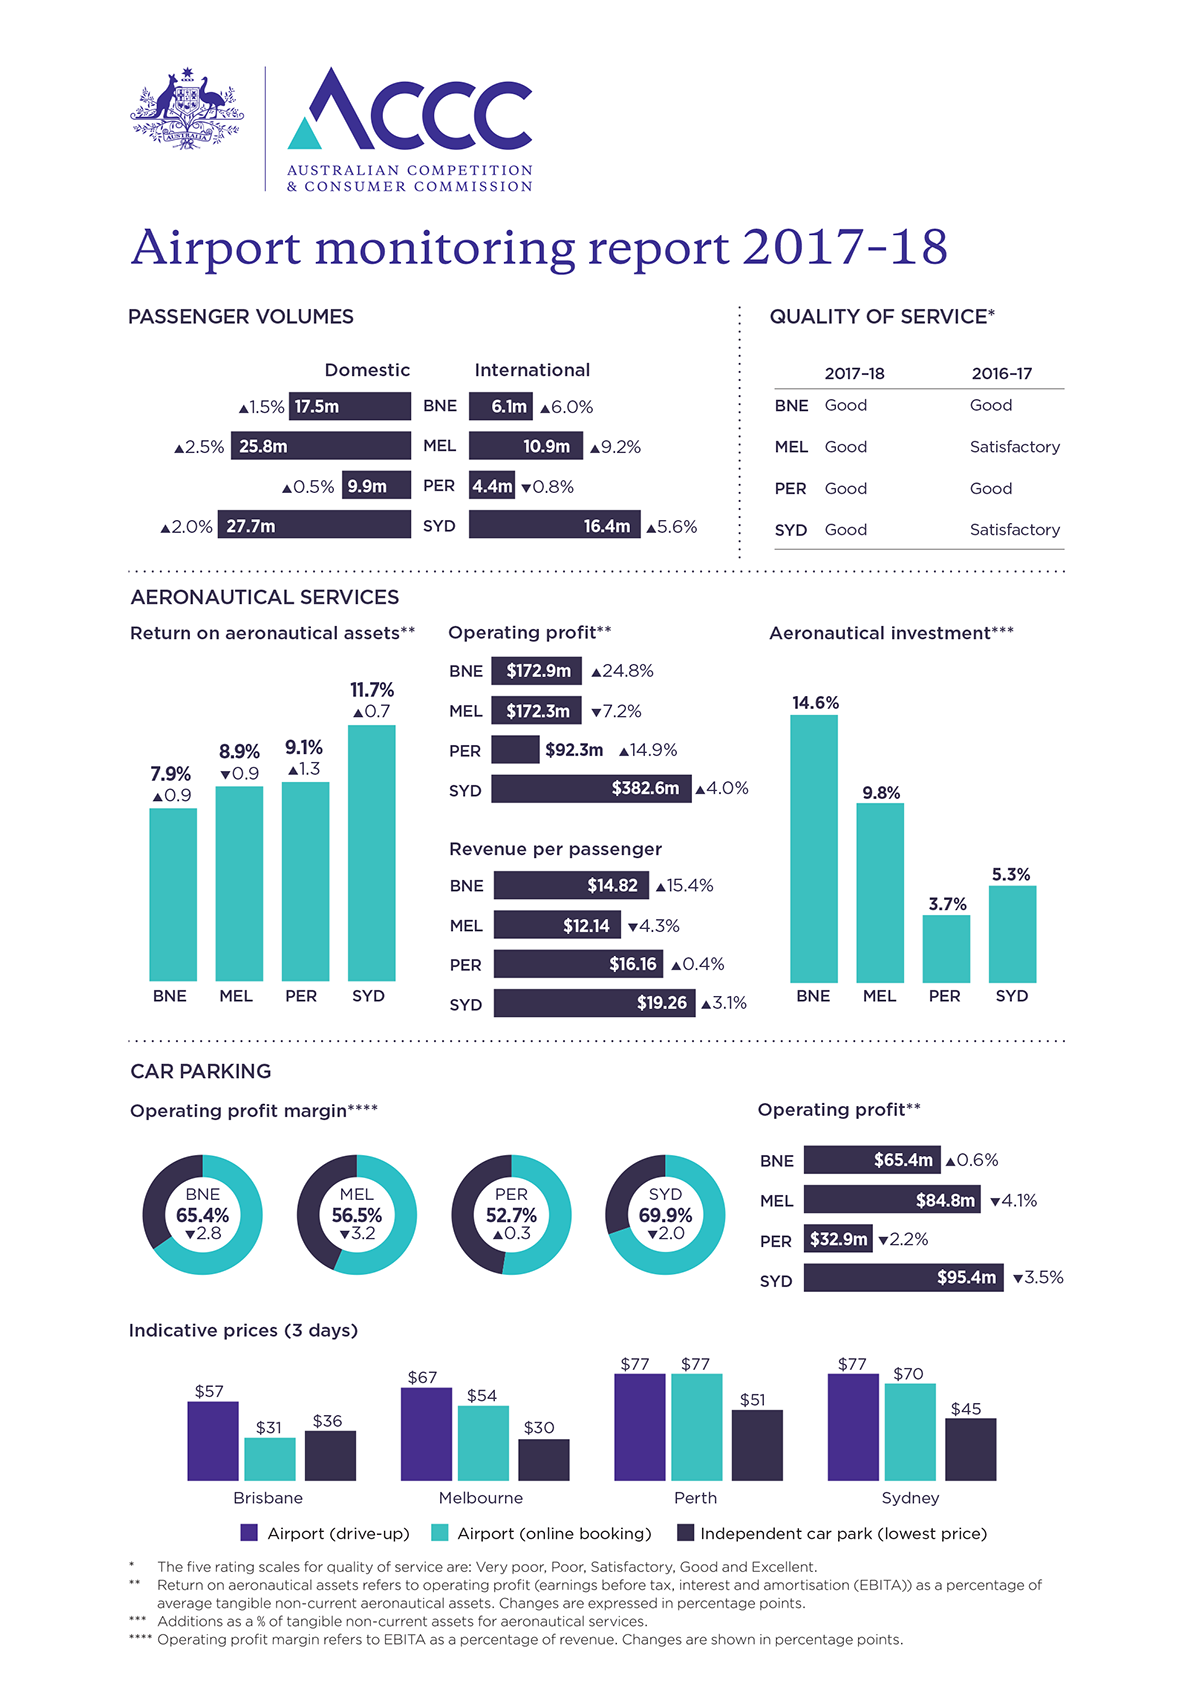
Combined operating profit from aeronautical activities at Sydney, Melbourne, Brisbane and Perth airports stood at $820.1 million for the year, up 6.2 per cent.
Brisbane Airport recorded the biggest jump in profit of 24.8 per cent after boosting its airline charges, while Perth’s profit grew by 14.9 per cent due to lower costs.
Sydney Airport’s annual profit of $382.6 million, up 4 per cent on strong passenger growth, accounted for nearly half of the total profits generated by the four.
Aeronautical revenue per passenger rose at three of the four airports, most rapidly at Brisbane Airport which posted the biggest rise of 15.4 per cent.
Melbourne recorded a 4.3 per cent drop on revenue per passenger while recording the highest growth in passenger numbers.
These four airports continue to be very profitable, with margins on aeronautical profits remaining strong at between 38.6 per cent in Melbourne and 49.3 per cent in Brisbane.
Brisbane, Perth and Sydney also reported higher returns on aeronautical assets, due in part to lower levels of investment. Sydney posted the biggest return of 11.7 per cent.
“Overall the growth in aeronautical profits at Australia’s four biggest airports continues apace,” ACCC Chair Rod Sims said.
“This growth has led to some of the airports more than doubling their profits over the past decade, even after accounting for inflation.”
Parking profits remain strong
The four airports together earned $278.5 million in operating profit from car parking.
Perth, Melbourne and Sydney airports all earned lower profits from car parking, but profit margins remained strong at between 52.7 per cent at Perth and 69.9 per cent at Sydney Airport.
Drive-up parking prices in some instances fell, including drops of about 20 per cent on some parking rates in Melbourne and Brisbane. The ACCC says that this may suggest the airports are facing some competitive pressure from other transport options, such as rideshare, off-airport parking and public transport.
“While some prices have fallen, parking costs remain a bugbear for passengers using Australia’s major airports,” Mr Sims said.
“Motorists should continue to look for savings by pre-booking online or parking with an independent operator.”
Charges for landside access services, such as taxis, ride-share operators and buses, is a growing source of revenue for the airports.
Quality of service rated ‘good’ at all airports
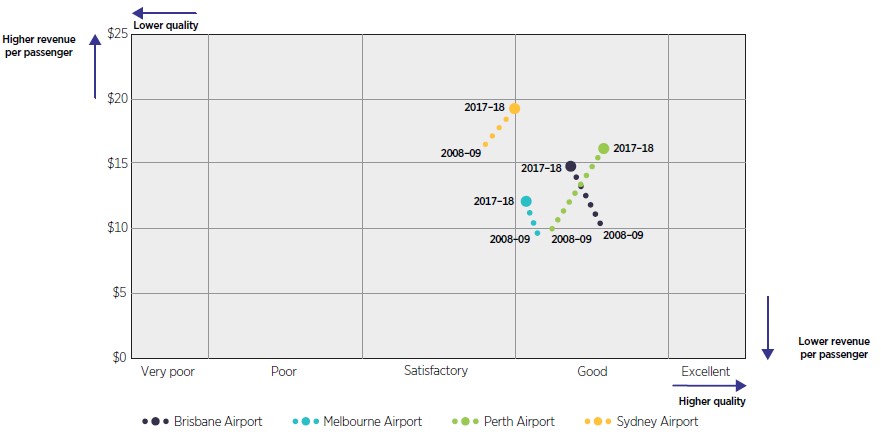
For the first time in a decade, all four monitored airports were rated as ‘good’ for their overall quality of service to passengers and airlines, with Sydney and Melbourne airports improving on last year’s ‘satisfactory’ rating.
Perth Airport received the highest overall quality of service rating and was also the only airport also rated ‘good’ by airlines.
“It is pleasing to see that all four airports have been rated as ‘good’ in terms of overall quality of service, but there is considerable scope for further improvement, in the service provided to airlines in particular,” Mr Sims said.
Price monitoring not enough
The Productivity Commission recently published its draft report examining the economic regulation of airports, which mostly endorsed the current approach of simply monitoring the airports’ activities.
The ACCC has strongly advocated the need for independent arbitration in cases where airports and airlines cannot agree on the pricing of aeronautical services.
“Our proposal for independent arbitration is a pragmatic solution for resolving disputes between airports and airlines,” Mr Sims said.
“Any party frustrating commercial negotiations would face the threat of an independent arbitrator determining prices and terms of access.”
“Price monitoring is not regulation. Monitoring alone is not enough to constrain the behaviour of companies with significant market power, such as airports.”
Background
The Australian government directed the ACCC to monitor the performance of the four largest airports until 2020. It is required to monitor both aeronautical and car parking activities. It is required to consider prices, costs, profits and quality of service.
The ACCC’s monitoring role does not include the power to intervene in the airports’ setting of prices for parking and aeronautical activities. However, the ACCC is required to assess any proposal by Sydney Airport to raise charges for regional air services.
The ACCC draws its information of the quality of service at airports from responses to surveys of passengers and airlines, and from objective data from the monitored airports. The ‘overall quality of service’ measure is calculated as an average of these ratings.
Price and quality comparisons between airports should be treated with some caution because results can be impacted by factors such as different terminal configurations, domestic/international passenger mix, and different approaches to valuing assets.
The ACCC’s monitoring role for aeronautical services relates only to those terminals that are owned and directly operated by the airports. Domestic terminals that are leased to and operated by domestic airlines are not subject to the ACCC’s monitoring. These terminals are the Qantas domestic terminals at Melbourne, Brisbane and Perth airports, as well as the Virgin Australia terminal at Brisbane Airport.
Supporting data
Operating profit refers to earnings before interest, taxation and amortisation (EBITA). Operating profit margin refers to EBITA as a percentage of revenue. Return on assets refers to EBITA as a percentage of average value of tangible non-current assets.
Table 1: Financial results of aeronautical and car parking services of the monitored airports, 2017–18
| Brisbane | Melbourne | Perth | Sydney | |
|---|---|---|---|---|
| Aeronautical operations | ||||
| Revenue ($m) | 350.7 | 446.2 | 231.1 | 849.0 |
| Operating profit ($m) | 172.9 | 172.3 | 92.3 | 382.6 |
| Profit margin (%) | 49.3 | 38.6 | 39.9 | 45.1 |
| Return on assets (%) | 7.9 | 8.9 | 9.1 | 11.7 |
| Car parking operations | ||||
| Revenue ($m) | 100.0 | 149.9 | 62.5 | 136.4 |
| Operating profit ($m) | 65.4 | 84.8 | 32.9 | 95.4 |
Profit margin (%) | 65.4 | 56.5 | 52.7 | 69.9 |
Note: Values are expressed in 2017-18 dollars.
Aeronautical revenue per passenger (in real terms) and aeronautical quality of service rating for the monitored airports: 2008–09 to 2017–18

Note: Revenue per passenger is presented in 2017–18 prices.


