Today, ice sheets cover an area that is almost as large as South America. Even though this equals only about three percent of the Earth’s surface, they play, similar to Arctic sea ice, a major role for the climate. In order to investigate ice sheets and their interaction with the climate, we are developing a climate model in which the extent of the ice sheets changes over time. Such changes and interactions have so far been insufficiently represented in conventional climate models.

The varying extent of ice sheets has so far been inadequately represented in conventional climate models.
© mattweis
Text: Marie -Luise Kapsch & Clemens Schannwell / Max Planck Institute for Meteorology
In recent decades the ice sheets of Greenland and Antarctica have decreased dramatically, and scientific projections suggest an increasing retreat in the future. Ice sheets form on land in regions with sufficient snowfall, which compacts and forms ice over time due to compression. They are therefore created differently to sea ice, which is often discussed in the public, and forms by the freezing of seawater. As the major part of an ice sheet is located on land, the melting of ice sheets leads to a rise in sea level, unlike the melting of sea ice. Depending on the amount of greenhouse gas emissions and the associated melting of the ice sheets, the sea level is likely to rise by between 0.3 and 1.1 metres until the end of this century. This has not only climatic but also socio-economic implications, as around 267 million people worldwide live in areas that lie less than one metre above sea level.
In the past several periods existed, during which ice sheets were exposed to strong climatic changes. For example, 21,000 years ago the global average temperature was about five degrees Celsius colder and the sea level about 120 metres lower than today. Large ice sheets covered Greenland, Antarctica and parts of North America and Eurasia – a total of approximately eight percent of the Earth’s surface. About 19,000 years ago, temperatures began to rise, and a large proportion of the ice sheets disappeared. This transition is called the last deglaciation. Today, only the Greenland and Antarctic ice sheets remain. In order to better understand these climate changes and the interactions between ice sheets and the climate, we perform long-term simulations using our newly developed climate model. By using this model, we also want to draw conclusions about the evolution of the future climate.
Small differences have a strong impact on the climate
One focus of our work has been to gain a better understanding of the impact of uncertainties in the extent and height of ice sheets on the climate. To do this, we simulated the last deglaciation with different ice-sheet reconstructions as boundary conditions. The reconstructions are obtained through the analysis of geological remains of past ice sheets, which are, however, temporally and spatially incomplete. This leads to various reconstructions, which differ considerably in terms of their ice sheet height and extent. Our model calculations show that even small differences in these characteristics have a strong effect on the climate. The differences influence both the climate during the last glacial period and the timing and extent of abrupt climate fluctuations during the last deglaciation in the northern hemisphere. The main reason for this is that the ice-sheet height and the addition of meltwater released into the ocean from changing ice sheets impacts the atmospheric and oceanic circulation. These in turn regulate how much heat is transported from subtropical regions into the North Atlantic and thus determine the climate in the adjacent regions, such as Europe.
Continuous ice stream after tipping point

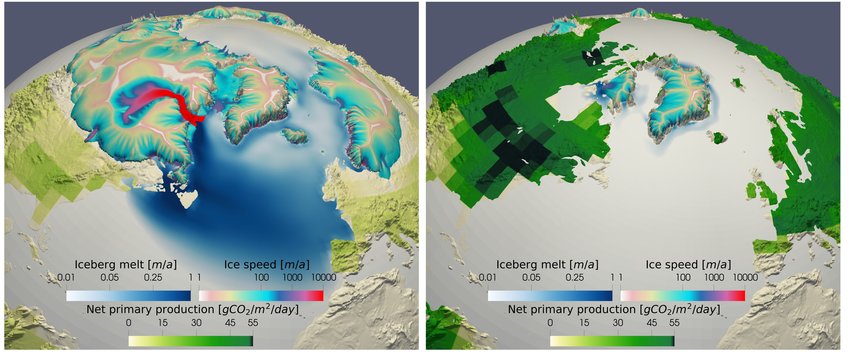
Simulated north hemispheric ice sheet extent at the Last Glacial Maximum (LGM – circa 21,000 years before present; left) and around 1850 (right). The figure shows ice velocity and primary production through photosynthesis, as well as meltwater input from icebergs to the ocean. During the LGM, a Heinrich event can be seen in the east of the North American ice sheet, which is characterised by an increased ice velocity and an increased input of meltwater by icebergs into the ocean. Simulated north hemispheric ice sheet extent at the Last Glacial Maximum (LGM – circa 21,000 years before present; left) and around 1850 (right). The figure shows ice velocity and primary production through photosynthesis, as well as meltwater input from icebergs to the ocean. During the LGM, a Heinrich event can be seen in the east of the North American ice sheet, which is characterised by an increased ice velocity and an increased input of meltwater by icebergs into the ocean.
© Clemens Schwannwell
During the LGM, a Heinrich event can be seen in the east of the North American ice sheet, which is characterised by an increased ice velocity and an increased input of meltwater by icebergs into the ocean. Simulated north hemispheric ice sheet extent at the Last Glacial Maximum (LGM – circa 21,000 years before present; left) and around 1850 (right). The figure shows ice velocity and primary production through photosynthesis, as well as meltwater input from icebergs to the ocean.
During the LGM, a Heinrich event can be seen in the east of the North American ice sheet, which is characterised by an increased ice velocity and an increased input of meltwater by icebergs into the ocean.
Major changes in the ice sheets also repeatedly influenced the climate between 60,000 and 25,000 years ago, the so-called marine isotope stage 3. This phase was characterised by strong, cyclical northern hemispheric temperature fluctuations. In addition, periodic instabilities of ice sheets occurred, referred to as Heinrich events, named after their German discoverer. During a Heinrich event, large amounts of icebergs were discharged from the North American ice sheet. These icebergs entered the ocean, where they influenced, among other things, the ocean circulation, and led to a significant cooling across the North Atlantic. The exact mechanisms that led to these events are still unclear.
We have carried out simulations to understand how different climatic conditions influence the timing of a Heinrich event. In our simulations, Heinrich events occur repeatedly in different regions of the North American ice sheet, but differ regionally in their dynamics. We have also found that a warmer climate often leads to the crossing of a critical threshold, or tipping point, at which Heinrich events may no longer occur and instead a continuous ice stream develops. Such a transition can raise sea levels by several metres and illustrates that past tipping points may have changed the long-term climate evolution.
Our studies underline the importance of ice sheets for the short- and long-term climate evolution. They show how important it is to take changes in ice sheets into account for model simulations of the past and future. In future work, we want to identify tipping points in the climate system that are a result of ice sheet changes and have the potential to alter the long-term climate evolution. These include changes to the jet stream, the Atlantic Meridional Overturning Circulation (AMOC), which comprises the Gulf Stream, and the ice-albedo feedback. The latter refers to ice reflecting more solar radiation than vegetation, therefore, the earth heats up less in areas covered by ice. Our model system allows us to fully understand and investigate these processes and the feedback between ice sheets and the climate.


